Population Structure
An understanding of the size and structure of Dudley Borough's population is key to planning current and future services, measuring the health of local people and identifying health inequalities. Estimates of the resident mid-year population by age and sex are produced every year by the Office for National Statistics (ONS). They are published at the end of June a year in arrears, so the 2018 mid-year estimates were published in June 2019. The two main contributors to population change are natural change, which is the number of births minus deaths, and net migration, which is the difference between long-terms moves into and out of the United Kingdom or local areas.
Dudley Borough Population
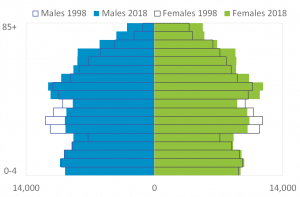
• The Dudley Borough population has grown from an estimated 304,800 in 1998 to 320,600 in 2018
• The population under 25 has increased by 4.5%
• The population aged 25 to 44 has decreased by 12%
• The population aged 45 and over has increased by 17.5%
• The population aged 80 and over has increased by 57.8%
Resident Population, 1998 and 2018
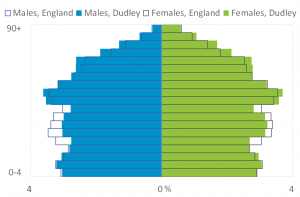
Dudley Borough compared to England
• The percentage of Dudley's population aged under 20 is the same as for England at 23.7%
• Between the ages of 20 and 44 Dudley has a smaller proportion of the population in every 5 year age band compared to England
• Between age 60 and 89 Dudley has a greater proportion of the population in every 5 year age band compared to England
• From age 90 the proportion of males and females for Dudley and England is almost identical